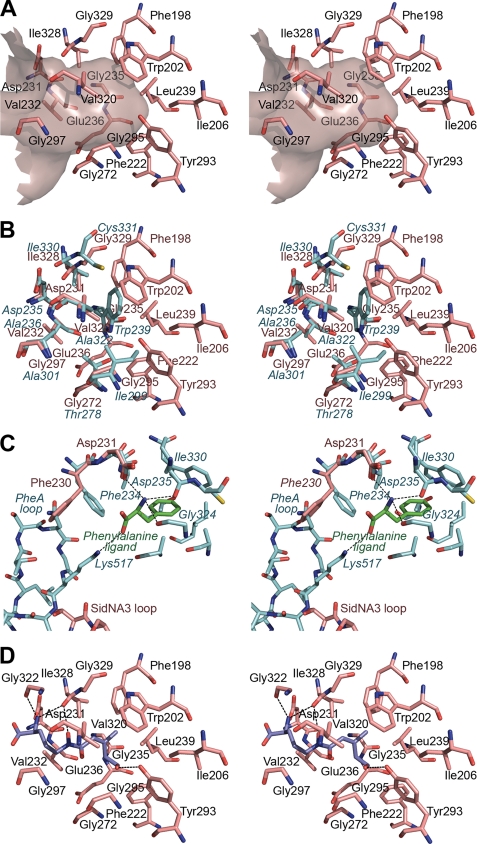
FIGURE 5.
Amino acid binding pocket of SidNA3. A, stereo “Connolly” surface (48) diagram of the amino acid binding pocket of SidNA3 and the residues lining it. The entrance to the pocket is to the left of the diagram. B, stereo diagram comparing the residues lining the amino acid binding pockets of SidNA3 and PheA (9). The SidNA3 residues are pink, and the PheA residues are blue. The residues of PheA are labeled in blue italics. C, stereo diagram comparing residues involved in binding the main chain atoms of the amino acid ligand in SidNA3 and PheA (9). The SidNA3 residues are pink; the PheA residues are blue, and the phenylalanine ligand of PheA is green. The C-terminal domain loops of both molecules are also shown. The only binding pocket-lining residues shown are those of PheA. The hydrogen bonds between PheA and the phenylalanine ligand are shown. D, stereo diagram of cis-AMHO docked into the binding pocket of SidNA3. The SidNA3 residues lining the binding pocket are pink. The top-ranked solution for the docking of the cis-AMHO ligand is shown in dark blue. The hydrogen bonds between SidNA3 and the docked ligand are shown (a hydrogen bond between the α-amino group of the ligand and Asp-231 is hidden behind the ligand).

