FIGURE 4.
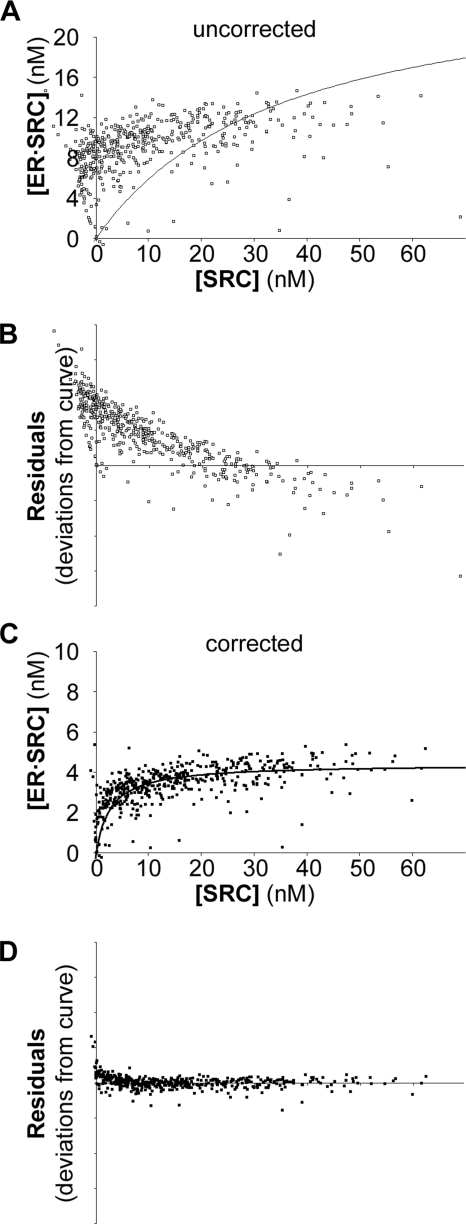
Transformation of FRET data into biochemical curves. A, Equations 2–4 were used to transform the data from the estradiol-treated cells shown in Fig. 2A assuming that all ERα was available in the cell to interact with SRC-RID at saturation. B, residuals show the extent to which each data point lies above or below the poor-fitting curve of panel A. C, the same data were transformed under variable assumptions of ERα availability or ER·SRC-RID stoichiometry until the corrected data were consistent with the total concentration of ERα-CFP measured in the cells. D, the residuals were more consistently distributed around the curve with the corrected data.

