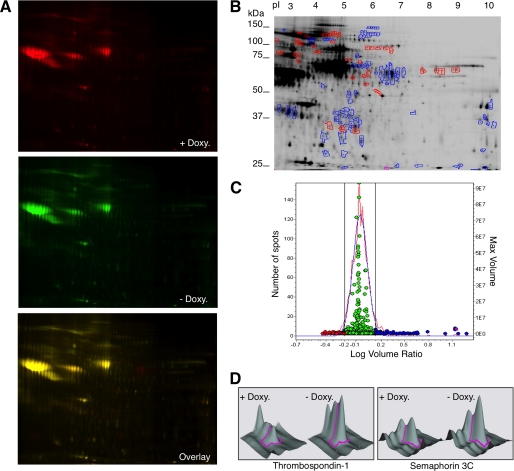
FIGURE 2.
Quantitative comparison between the glycosylated secretome of control cells and cells overexpressing ADAMTS1 by DIGE. A, fluorochrome-labeled glycoproteins from MCF7 Tet-Off/ADAMTS1 cells treated with or without doxycycline (Doxy., i.e. control cells or cells overexpressing ADAMTS1, respectively, see Fig. 1, C and D) were analyzed into a two-dimensional gel. The gel was scanned with different wavelengths to visualize proteins labeled with Cy3 or Cy5. B, a total of 1414 spots was analyzed. 132 showed a >1.5-fold change. 83 spots increased in intensity (blue dots/blue-encircled spots), whereas 49 spots decreased (red dots/red-encircled spots) upon ADAMTS1 overexpression. C, experimental (red curve) and normalized model (blue curve) frequency distribution of volume ratios (volume in the Cy5 image divided by volume in the Cy3 image) for the spots detected in the fluorescence images shown in B. The volume of each individual protein spot, represented as a single data point, is plotted in the right axis. The spots in blue and red represent proteins with a higher than 1.5-fold or lower than 0.66 variation, respectively, in the glycoprotein secretome of cells overexpressing ADAMTS1. D, shown is a three-dimensional profile for the spots corresponding to thrombospondin-1 and semaphorin 3C as determined by the DIGE analysis shown in B.

