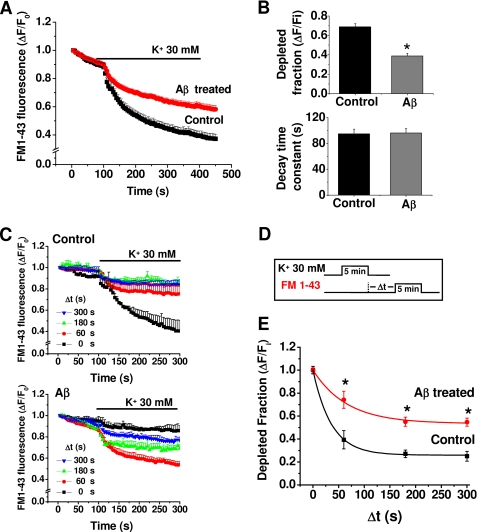
FIGURE 3.
Aβ reduced synaptic vesicle recycling. A, K+-induced destaining of FM1-43 in control and Aβ-treated neurons. B, effect of Aβ (500 nm, 24 h) on fractional and time constant of FM1-43 release. C, ratio of endocytosis of FM1-43 following a variable time delay (0–300 s) from an initial depolarizing K+ pulse in control and treated neurons. D, protocol used to load FM after variable times of exocytosis. E, time course of FM1-43 fluorescence constructed from the data in C for control and treated neurons. The lines are the best single-exponential fit to the data. The symbols are mean ± S.E. from 12 independent recordings (*, p < 0.05).

