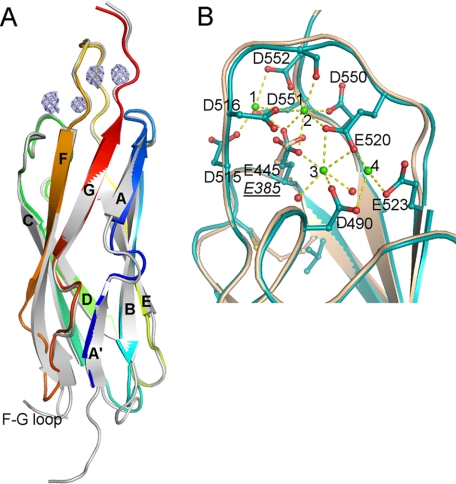
FIGURE 1.
Crystal structures of CALX-CBD1. A, structural alignment of the CBD1 from CALX and NCX1. CALX-CBD1 shown as rainbow ribbons was superimposed on the NCX1-CBD1 crystal structure shown in gray. The anomalous difference map is displayed in slate and contoured at 6.0σ to indicate the Ca2+ positions. The short F–G loop of CALX is highlighted, whereas that from NCX1 is invisible. B, structural alignment of the Ca2+ binding sites of CALX-CBD1 and NCX1-CBD1. The Ca2+-bound CALX-CBD1 structure in cyan is superimposed onto the NCX1-CBD1 structure (colored in wheat). Four Ca2+ and water molecules are represented as green and red spheres, respectively. The residues coordinating Ca2+ are shown as stick balls; Ca2+ interactions with residues are shown as yellow dashed lines. The label for the E385 residue in NCX1 is shown in underlined italics.

