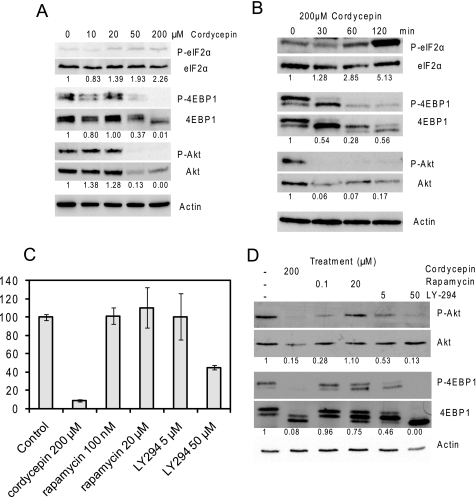
FIGURE 5.
Cordycepin inhibits mTOR signaling. A, Western blots of extracts from NIH3T3 cells treated for 2 h with increasing doses of cordycepin. Blots were developed as indicated with antibodies specific for total eIF2α and its phosphorylated form (Ser51), total 4EBP1 and its phosphorylated forms (Thr37/46), Akt1 and its phosphorylated form (Ser473), and β-actin (as a loading control). Ratios between phosphorylated and total protein levels are given under the blots, with the ratio for the control set at 1. B, Western blots of extracts of cells treated for different time periods with 200 μm cordycepin. C and D, the effect of the mTORC1 inhibitor rapamycin and the phosphatidylinositol 3-kinase inhibitor LY294,002 on protein synthesis and phosphorylation of proteins. C, protein synthesis rates of NIH3T3 cells as measured by 35S incorporation into protein, corrected for total protein concentration. D, Western blots of extracts treated with inhibitors as described above.

