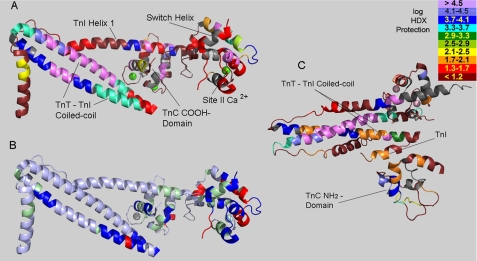
FIGURE 5.
Three-dimensional structure mapping of H/D exchange protection. A, high Ca2+ results from Fig. 4 are mapped onto the Ca2+-saturated structure of the cardiac troponin core domain. Gray indicates sections where no H/D exchange data were obtained. B, map of troponin regions with exchange rates altered by Ca2+ saturation of TnC site II. In high Ca2+ conditions relative to low Ca2+ conditions, blue indicates slower exchange, red indicates faster exchange, silver (light blue) indicates statistically insignificant alteration, and green indicates regions without data for comparison between high and low Ca2+. C, low Ca2+ results from Fig. 4 are mapped onto the proposed model of skeletal muscle troponin core domain under low Ca2+ conditions (Mg2+/EGTA) (5). The orientation in panel C is different from panels A and B, and only partial superposition is possible in any orientation. The indicated TnI segment is the inhibitory region, which is disordered so not shown in panels A and B.

