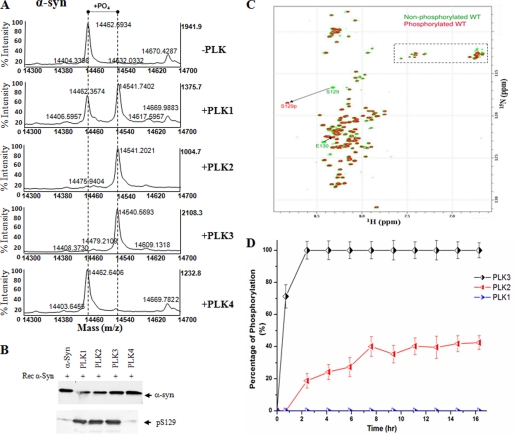
FIGURE 2.
In vitro phosphorylation of synucleins by PLK1 to -4. A, MALDI-TOF analysis of the WT α-syn after phosphorylation by PLK1 to -4. For PLK1 to -3, there is an 80-Da increase in the molecular mass of WT α-syn (14,461 + 80 = 14,541), corresponding to one phosphorylation. B, Western blot analysis of the same samples in A. The anti-Ser(P)-129 antibody detected a band, suggesting that the phosphorylation detected by mass spectrometry is at position 129. C, comparison of two-dimensional 1H,15N HSQC spectra of unphosphorylated WT (green) and α-syn phosphorylated by PLK3 (red). A dashed rectangle marks glutamine (Q) and asparagine (N) side chain resonances. D, kinetics of in vitro phosphorylation of Ser-129 in α-syn by PLK3 (black), PLK2 (red), and PLK1 (blue) as monitored by real-time NMR spectroscopy. NMR samples contained ∼0.1 mm 15N-labeled α-syn in 200 mm HEPES, 10 mm MgCl2, 2 mm dithiothreitol, and 1.09 mm ATP, pH 6.9. The real-time assay was started by the addition of kinase into the NMR sample using a protein/kinase ratio of 100:0.5 mg. The error bars were determined based on the signal/noise ratio observed in the NMR spectra.

