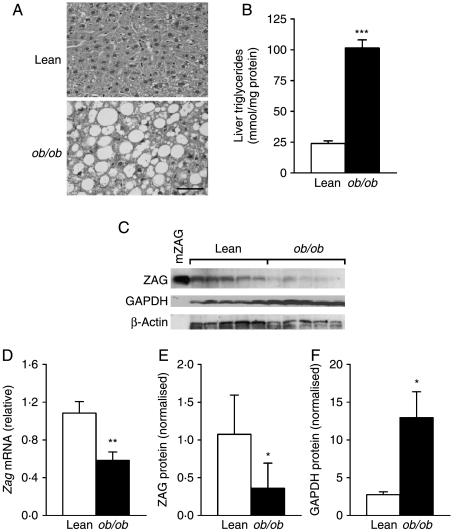
Figure 3.
Zag mRNA and protein expression in the liver of ob/ob and lean mice. (A) Histology of the liver sections stained with H&E (bar, 50 μm); (B) liver triglyceride content; and (C) representative western blot of ZAG and GAPDH protein, recombinant mouse ZAG (mZAG) used as a positive control. (D) Liver Zag mRNA levels were measured by real-time PCR and normalised to β-actin; (E) quantification of ZAG protein normalised to β-actin and (F) quantification of GAPDH protein normalised to β-actin. Data are means±s.e.m. for groups of 7. *P<0·05, **P<0·01 compared with lean controls.

