Figure 1.
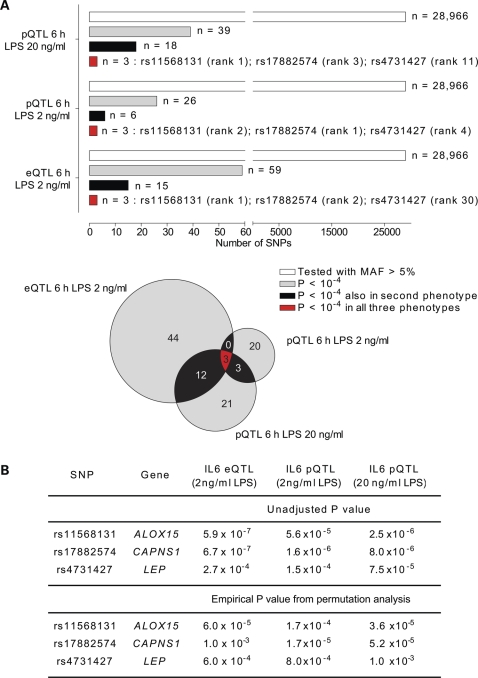
LPS-induced IL-6 transcript and protein expression phenotype mapping. (A) eQTL/pQTL analysis showing concordance of SNP associations for IL-6 expression phenotypes (unadjusted P-values less than 10−4) for rs11568131, rs17882574 and rs4731427 with rank order of association indicated. (B) Unadjusted P-values for SNP associations together with empirical P-values derived from permutation analysis with population correction.

