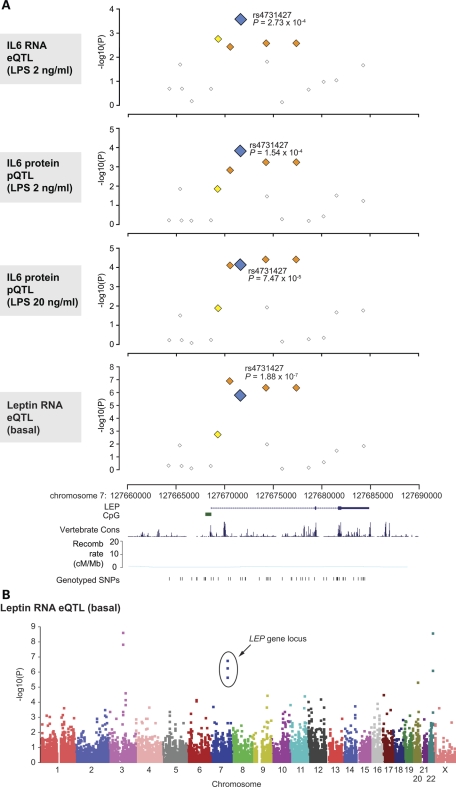
Figure 2.
Common SNP markers in LEP are associated with IL-6 and leptin expression. (A) Single marker allelic association results for LEP gene locus with IL-6 or leptin expression plotted as −log10(P) values by genomic coordinate. With reference to rs4731427, SNPs with MAF greater than 5% and r2 < 0.2 are shown as white squares, 0.2–0.5 (yellow) and 0.5–0.8 (orange). LEP gene structure and genotyped SNPs are shown below. Estimated recombination rates are shown from HapMap (using Build 35 coordinates). Gene structure, vertebrate multiz alignment and conservation track (17 species) (49) and genotyped SNP locations adapted from screenshot of the UCSC Genome Browser (Human March 2006 Assembly). (B) Manhattan plot showing strength of association from PLINK analysis plotted as −log10(P) values by chromosome for leptin expression.

