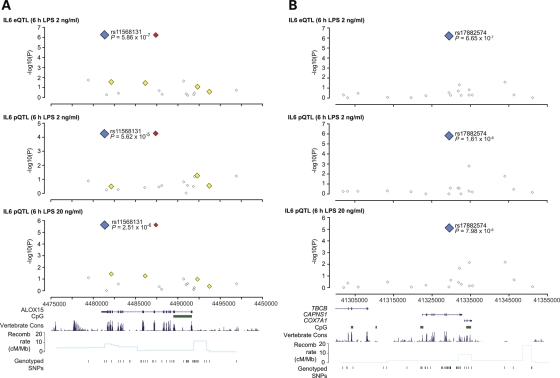
Figure 5.
Association with IL-6 and SNP markers at ALOX15 and CAPNS1. Single marker allelic association results for IL-6 eQTL and pQTLs are shown plotted as −log10(P) versus genomic coordinate for (A) ALOX15 gene region and (B) CAPNS1 gene region. For each of the top associated SNPs in the two gene loci (plotted with blue squares), SNPs with MAF greater than 5% and r2 < 0.2 are shown as white squares, 0.2–0.5 (yellow) and >0.8 (red). In total, 45 SNPs over a 20 kb region spanning ALOX15 and 47 SNPs over a 50 kb region at CAPNS1 were genotyped.

