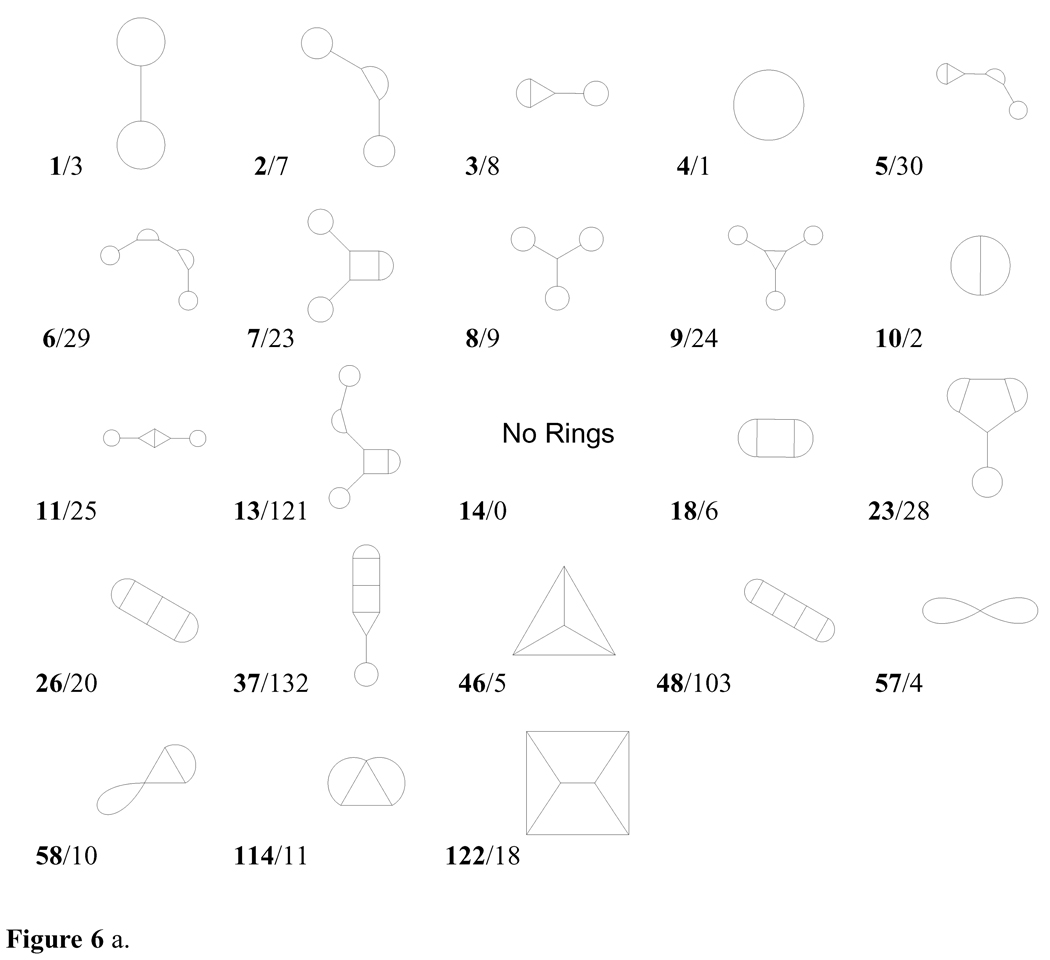
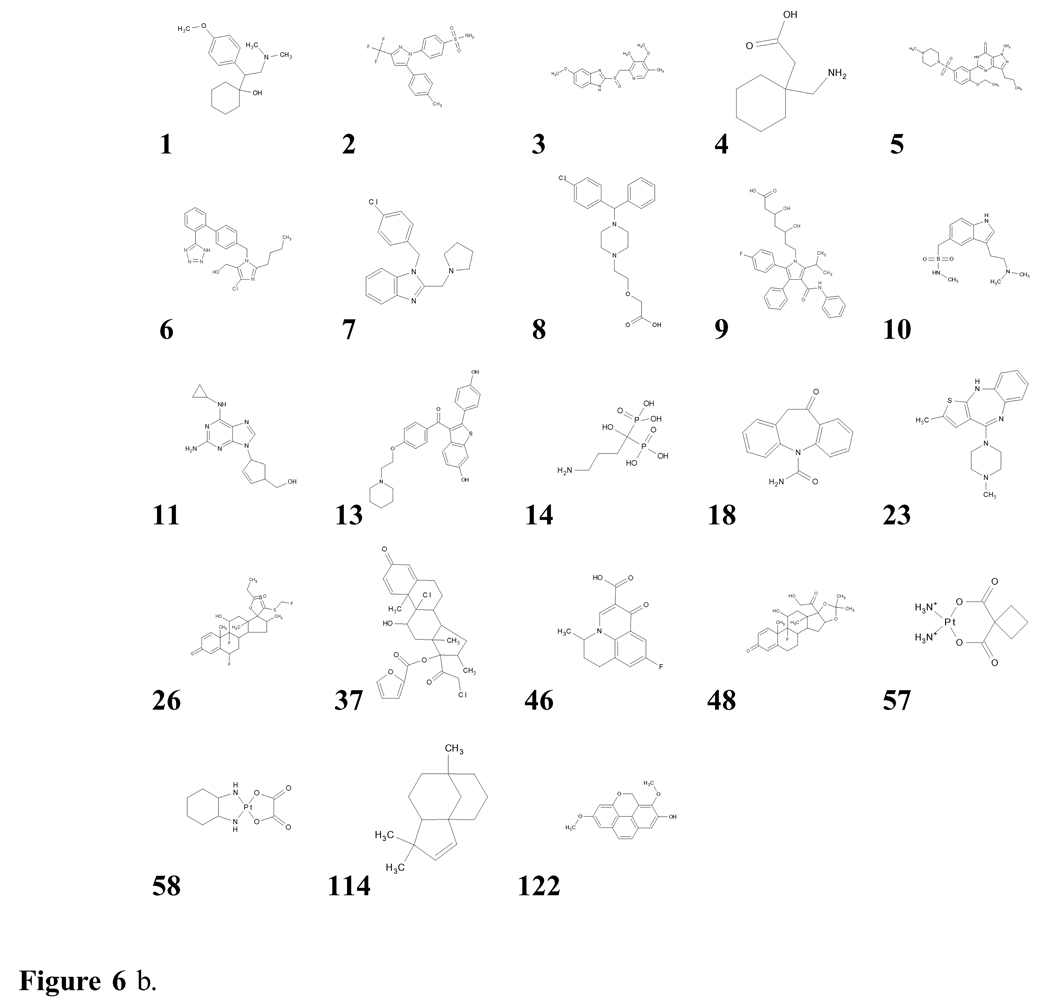
Figure 6.
Figure 6 a. The most frequent topologies present in the databases examined, numbered (in boldface) by their rank in the merged database. The second value for each entry is the topology number, 1–33 and 86–89 of which are shown in Figure 2a
Figure 6 b. Examples39 from the databases examined of the most frequent topologies present, numbered by their rank in the merged database (compare with Figure 6a).


