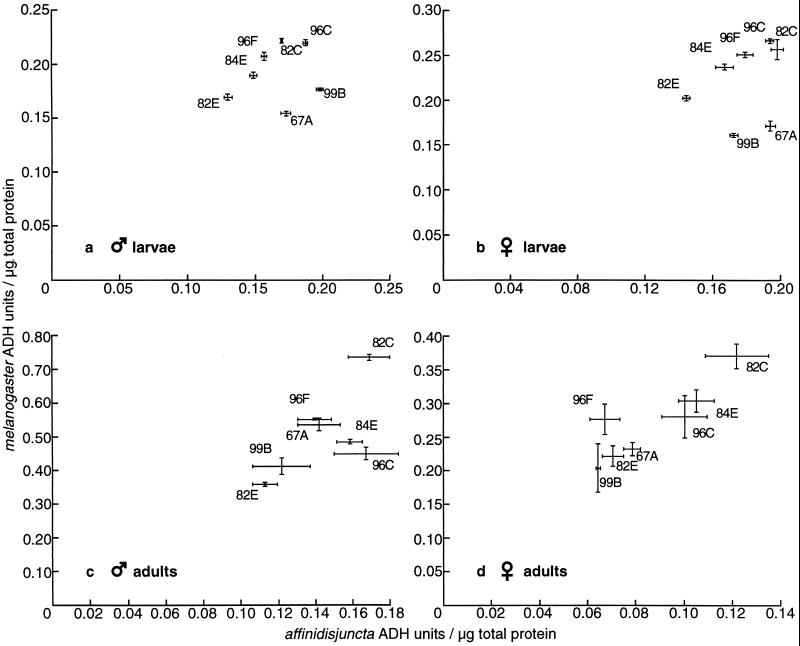
Figure 2.
Specific activity measurements for preparations of male (a) and female (b) third-instar larvae and male (c) and female (d) adults (6–8 days post-eclosion). In each graph, ADH specific activity of P[^m>] derivatives is plotted against ADH specific activity of P[^a>] derivatives for each genomic location (identified by cytological position in polytene chromosomes). SE bars are shown.

