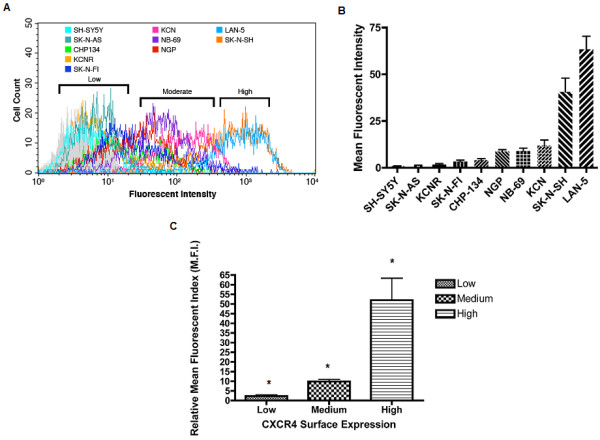
Figure 1.

CXCR4 is Differentially Expressed on the Surface of Neuroblastoma Cells. Neuroblastoma cells were cultured to 80% confluency, harvested with versene followed by washing in culture media, then a modified phosphate buffered saline (PBA). 5 × 10⁵ intact and non-permeabilized cells were incubated with a PE-conjugated Anti-CXCR4 monoclonal antibody (12G5) for 30 minutes, washed and flow cytometry was performed to measure cell surface associated fluorescence. A) Frequency histogram showing distribution of fluorescent intensities associated with cell surface of labeled cells. Fluorescent intensity is shown on the x-ordinate and the number of cell events on the y-ordinate. A total of 1000 events were recorded for each measurement. Three distinct ranges of distribution are evident (brackets). Data shown is from one experiment and is representative of results obtained from three experiments. B) The geometric mean fluorescent intensity for each cell line was determined after staining with anti-CXCR4 antibody, this value was then normalized to the corresponding geometric mean fluorescent intensity obtained from surface staining each cell line with the PE-conjugated isotype matched control antibody (Mouse IgG2a). Final quantitative values are represented as a relative mean fluorescent intensity (M.F.I.) +/- SD obtained, from three experiments. Means were stratified into three classes of surface expression and the following cutoffs were used to define each class: Low= M.F.I. <5; Medium = M.F.I. 5-20; High = M.F.I. >20 (see table 1). C) The mean plus SD was determined for each surface expressing class using the intensities of all the cell lines in that class. The mean value of each class falls within the parameters used to define that class. All means were significantly different from one another. (*P < 0.0001, One-way ANOVA).
