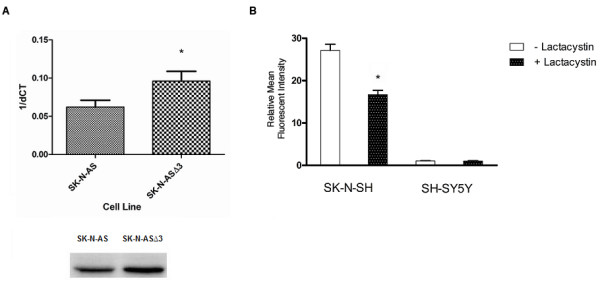
Figure 8.

Evidence for Proteasomal Regulation of CXCR4 Structure-Function. A) Comparison of Cul-5 Expression in SK-N-AS vs. SK-N-ASΔ3 Cells. Top-Quantitative PCR was performed for 30 cycles of amplification using CUL-5 primers and a total of 250 ng of template cDNA from either SK-N-AS or SK-N-ASΔ3. Result represents the mean +/- SD from three experiments (*P < 0.005, paired t-test). dCt values for CUL-5 transcripts were normalized to the endogenous control glyceraldehyde phosphate dehydrogenase. Bottom-Western blot was performed on total cell lysates from SK-N-AS and SK-N-ASΔ3 cells using anti-CUL-5. B) Effect of Proteasomal Inhibitor Lactacystin on CXCR4 Surface Expression. Cells were cultured in the presence of 10 μM of lactacystin. After 12 hrs of treatment cells were harvested and processed for FACS analysis. The high CXCR4 surface expressing cell line SK-N-SH and its low surface expressing subclone were both analyzed. PBS was used as a negative control.
