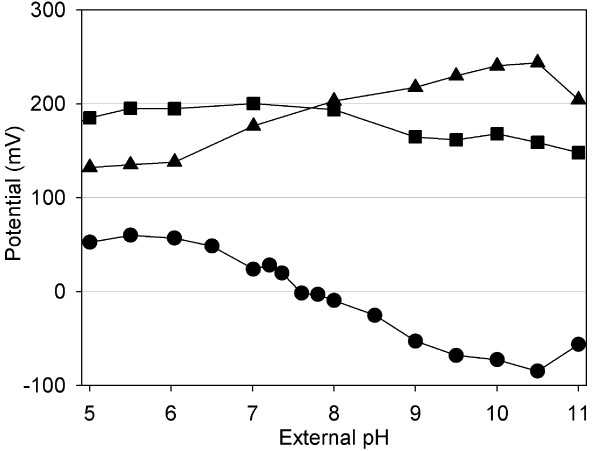
Figure 2.
The pH dependent bioenergetic homeostasis in C. glutamicum. Membrane potential (triangles) and pH gradient (circles) across the cytoplasmic membrane of C. glutamicum exposed to different external pH values and values for the resulting proton motive force (squares). All values are given in mV.

