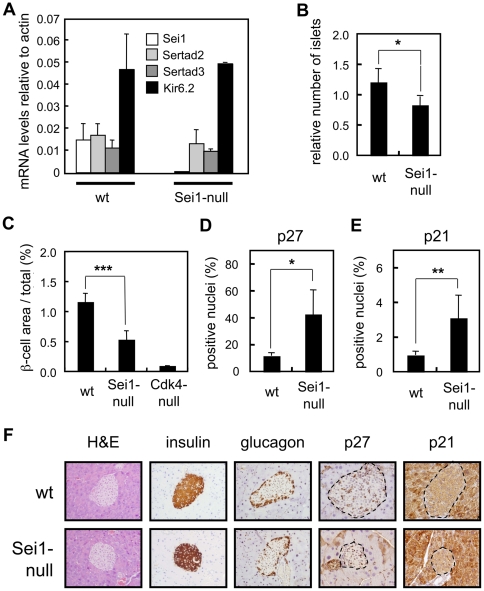
Figure 8. Pancreatic islets in Sei1-null mice.
(A) Levels of mRNA expression of the Sertad family members Sei1, Sertad2 and Sertad3, as well as, the pancreatic islet gene Kir6.2, were measured using qRT-PCR in total mRNA from isolated pancreatic islets of wt (n = 4) and Sei1-null (n = 2) male mice. (B–F) Paraffin sections of pancreas (n = 4 per genotype) of the indicated genotypes were stained with antibodies against insulin (B and C), p27Kip1 (D) or p21Cip1 (E). (B) Number of islets relative to the total area of the pancreas. (C) Ratio between the β-cell islet area and the total pancreas area. (D) p27Kip1- or (E) p21Cip1-positive nuclei relative to total β-cell area. (F) Representative examples of the indicated stainings. The dotted lines mark the limits of the pancreatic islets. Values correspond to the average and s.d. Statistical differences were determined by the Student's t-test; *p<0.05; **p<0.01; and ***p<0.001.

