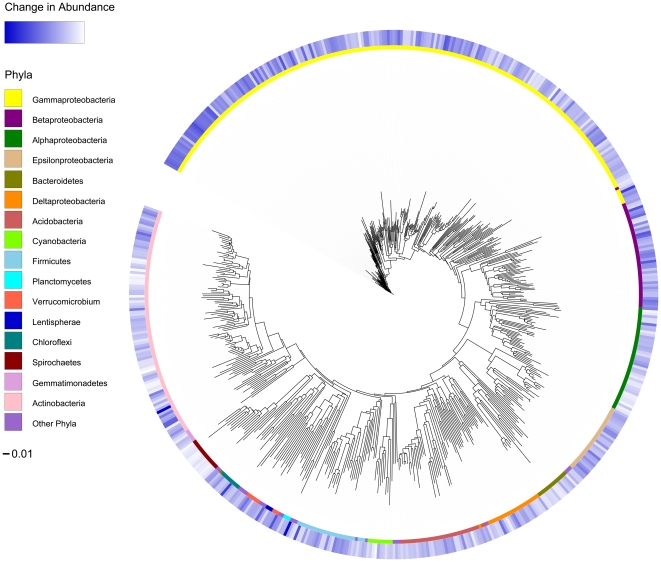
Figure 3. Significant Differences in Abundance of Taxa.
Phylogenetic tree displaying taxa significantly increased in relative abundance in LGG dominated samples as a heatmap of fluorescence intensities in the outer ring. The inner ring displays the phylogenetic affiliation of each bacterial taxon at the level of class or higher. The scale bar indicates 0.01 nucleotide substitutions per base.

