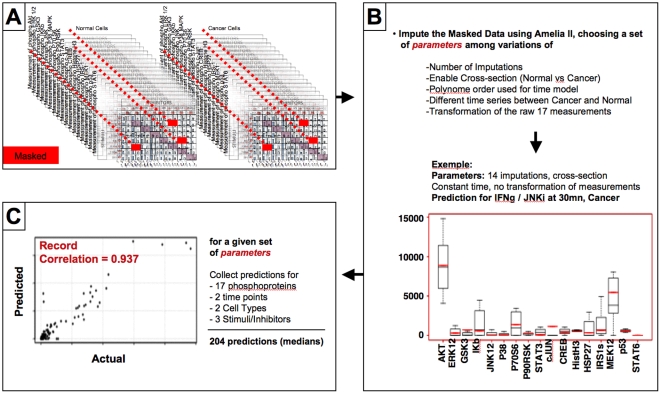
Figure 4. Identification of the best multiple imputation parameters.
A. Selection of three Stimulus/Inhibitor pairs and masking (red) of the 17 associated phosphoproteomics measurements at 30 and 180 mn in both normal and cancer cells (17×3×2×2 = 204 masked measurements). B. Example of multiple imputations results with a given set of Amelia II parameters for the 17 masked phosphoproteomics measurements associated with an IFNγ stimulation and JNK inhibition at 30 mn in cancer cells. The boxplots show the spread of the 14 multiple imputations performed for each phophoprotein and the median of the prediction (black) can be compared to the actual measurement (red). C. The correlation between the median of each of the 204 predictions and the 204 actual measureents which have been masked is computed and provides an evaluation of the prediction performance for a given set of Amelia II input parameters.

