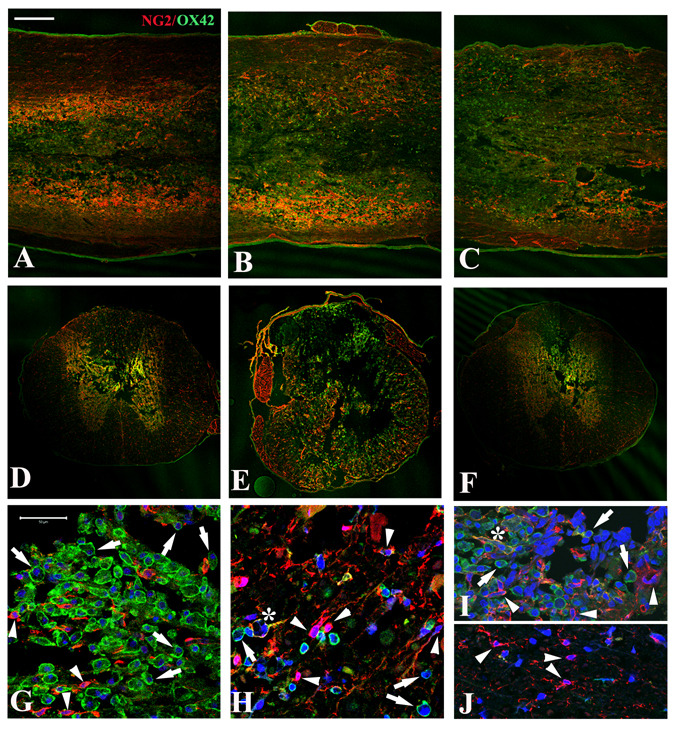
Figure 1.
Distribution of NG2+ cells and microglia/macrophages in situ at 3 days after spinal cord injury. A–C: Horizontal sections through the dorsal funiculus of injured spinal cords show strong immunoreactivity with NG2 (red) and OX42 (green) antibodies at the injury epicenter (B) as well as rostral (A) and caudal (C) to it. D–F: Coronal sections at the injury epicenter (E) and 5 mm rostral (D) or caudal (F) to it show that OX42+ cells are concentrated in the lesion with NG2+ cells more evident in the surrounding spared tissue, especially in the spared tissue bordering the lesion. Scale bar for A–F = 500 µm. G–J: At higher magnification, the distribution of OX42+ and NG2+ cells in different regions is seen more clearly. In the lesion epicenter (G), numerous OX42+ cells (green, arrows) are present in clusters as well as some NG2+ cells. Both types of cells are present in the residual lateral white matter at the epicenter (H), but with more NG2+ cells (red, arrowheads) and fewer OX2+ cells (green, arrows). Occasional NG2+/OX42+ cells (H) are also present (yellow, *). At 4 mm rostral to the epicenter, the tapering dorsal-central lesion area (I) contains both OX42+ and NG2+ cells similar to the lesion at the epicenter (G), while only NG2+ cells appear in the preserved ventral white matter (J). Scale bars for G–J = 50 µm.

