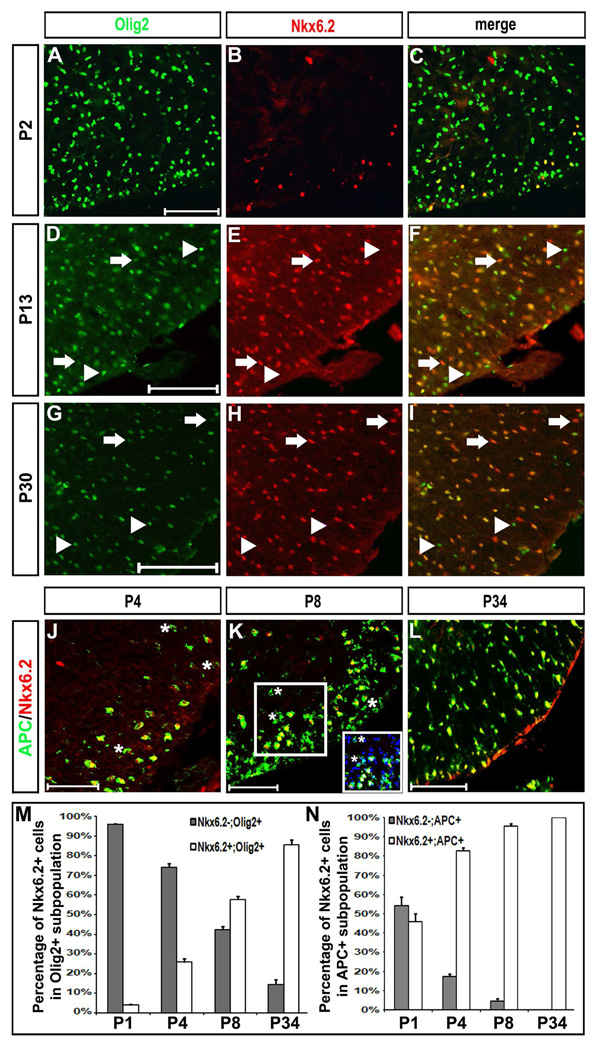
Figure 4.
Co-expression of Nkx6.2 with Olig2 and APC in spinal cord oligodendrocytes. Spinal cord sections from P2 (A–C), P4 (J), P8 (K), P13 (D–F), P30 (G–I) and P34 (L) wild-type pups were subject to double immunofluorescent staining with anti-Nkx6.2 and anti-Olig2 (A–I), or anti-Nkx6.2 and anti-APC (J–L). Only the ventrolateral spinal cord positions were shown. The Nkx6.2+++/Olig2+ and Olig2+++/Nkx6.2- single positive cells were represented by arrows and arrowheads, respectively. The percentage of Nkx6.2+ and Nkx6.2- cells in APC+ or Olig2+ population from P1 to P34 were shown in M and N. The Nkx6.2+ cells in C and J and represent the ventral interneurons. The APC+/Nkx6.2- cells were indicated by asterisks. Inset in K showed the APC/Nkx6.2/Dapi triple labeling from the outlined region. Scale bar: 100 µm.

