Fig. 5.
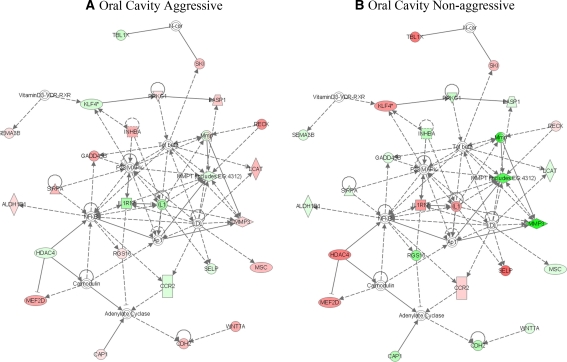
Network of oral cavity HNSCC discriminating aggressive and non aggressive tumors. The median values for aggressive (a) and non aggressive (b) oral cavity HNSCC were subjected to analysis by IPA. The highest scoring network for aggressive (48, 24 focus molecules) and non aggressive (48, 24 focus molecules) tumors are shown. Genes or gene products are represented as nodes, and the biological relationship between two nodes is represented as an edge (line). All edges are supported by at least 1 reference from the literature, from a textbook, or from canonical information stored in the Ingenuity Pathways Knowledge Base. The intensity of the node color indicates the degree of up- (red) or down- (green) regulation. Nodes are displayed using various shapes that represent the functional class of the gene product. Edges are displayed with various labels that describe the nature of the relationship between the nodes. A complete list of the shapes for each node, as well as the line types representing each edge, is available in the tutorial section at www.ingenuity.com

