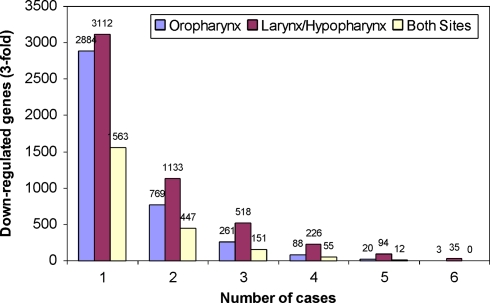
Fig. 8.
Numbers of down-regulated genes identified in comparisons of primary HNSCC to corresponding adjacent mucosa using the 27,323 element cDNA microarray. Bars indicate the number of genes down-regulated at least 3-fold in at least one patient through all six cases for a given anatomic site. Both oropharynx and larynx/hypopharynx cases are shown, as well as the number of genes that are found in both datasets for a given frequency

