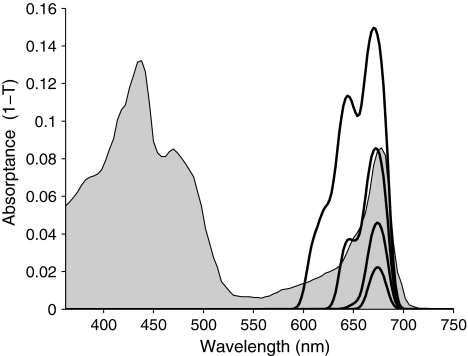
Fig. 4.
Detail of Fig. 2 for high costs. Absorptance spectra corresponding to the transmitted power spectra shown in Fig. 3. The gray shaded spectrum is an absorptance plot of the absorption spectrum of spinach chloroplasts, corrected for scattering and flattening (Latimer and Eubanks 1962) and arbitrarily normalized to obtain an absorptance at the red maximum corresponding to that of the most similar theoretical curve

