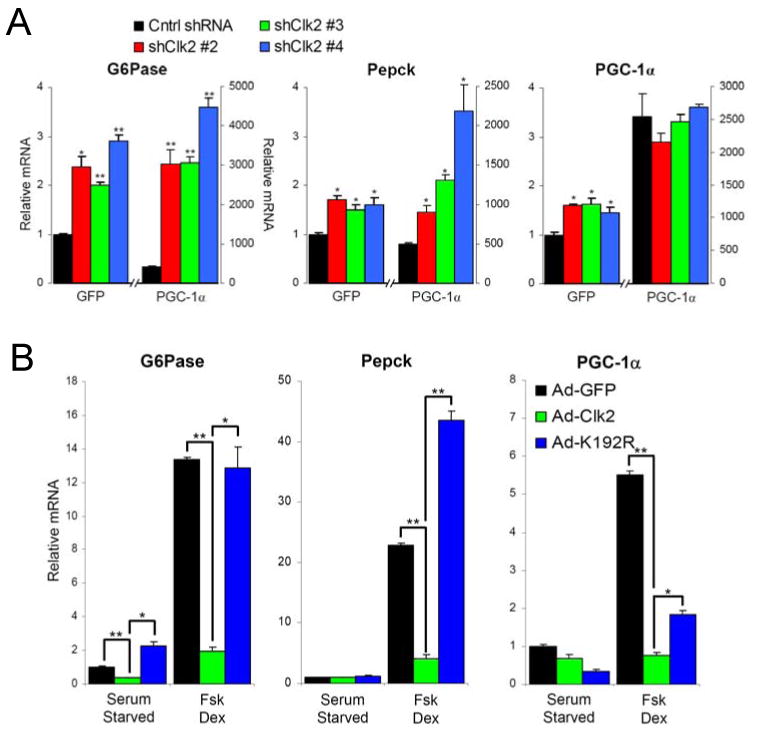
Figure 4. Clk2 represses gluconeogenic gene expression in primary hepatocytes.

(A) Clk2 shRNA induces gluconeogenic gene expression. Q-RT-PCR analysis of total RNA from primary hepatocytes infected with GFP or PGC-1α and Control shRNA or Clk2 shRNA adenoviruses. Cells were grown for 2 days post infection in DMEM + 10%FBS. Each bar N=4. (B) Clk2 expression suppresses gluconeogenic gene expression. Q-RT-PCR analysis of total RNA from primary hepatocytes infected with GFP, Clk2, or Clk2 K192R adenoviruses. 24 hours after infection Cells were switched to starvation media 6 hours prior to treatment with 10μM forskolin and 1 μM dexamethasome for 1.5 hours. Each bar N=4. All data is presented as average +/- SEM. Experiments performed at least 3 times with similar results. Significance determined by two-tailed unpaired Students T-Test * denotes P<0.05, ** P<0.01.
