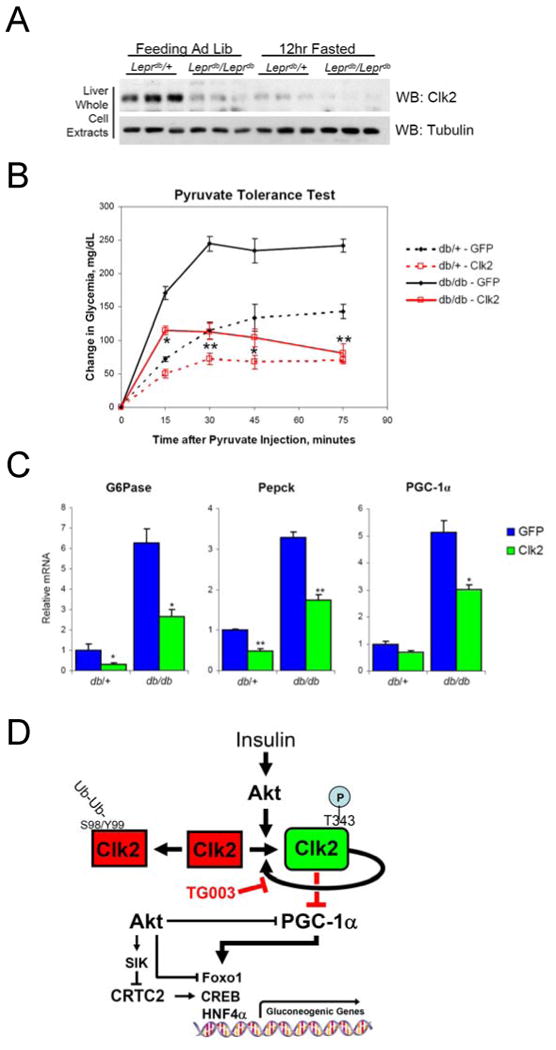
Figure 6. Hepatic Clk2 expression normalizes db/db diabetic phenotype.

(A) Clk2 protein is down regulated in db/db mice. Western blot analysis of liver whole cell extracts from heterozygous control mice (Leprdb/+) or homozygous db/db mice (Leprdb/Leprdb) sacrificed during the feeding or 12hour fasted. (B) Pyruvate tolerance test from db/db or db/+ mice infected with GFP or Clk2 adenovirus. Mice were fasted overnight prior to intraperitioneal administration of 2g/Kg pyruvate. Data presented as average +/- SEM, db/db mice each line N=4, db/+ mice each line N=2. Significance indicated is determined between db/db GFP vs. db/db Clk2. (C) Q-RT-PCR analysis of gluconeogenic gene expression from total liver RNA from db/+ or db/db mice following an overnight fast. Data presented as average +/- SEM, db/db mice each bar N=4, db/+ mice each bar N=2. (D) Proposed model depicted regulation of Clk2 kinase activity, stability, and suppression of PGC-1α and gluconeogenesis. Significance determined by two-tailed unpaired Students T-Test * P<0.05, ** P<0.01.
