Figure 8.
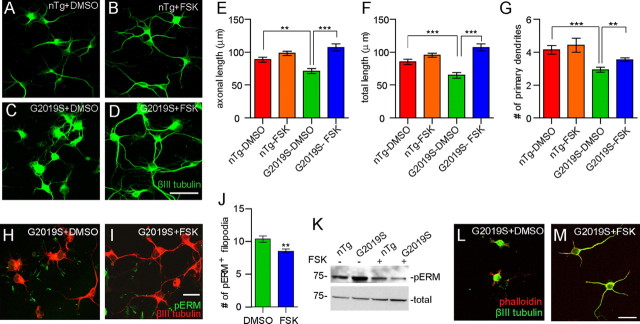
Forskolin application reverses the G2019S-dependent neuronal growth defects. A–D, Representative images show nTg (A, B) and G2019S (C, D) hippocampal neurons stained with βIII-tubulin after treatment with DMSO (A, C) or FSK (B, D). E–G, Bar graphs represent the quantification of axonal length (E), total neurite length (F), and the number of primary neurites (G) of vehicle- or FSK-treated nTg and G2019S neurons. H, I, Representative images display G2019S neurons stained with βIII-tubulin (red) and pERM (green) after treatment with either DMSO (H) or FSK (I). J, Bar graph depicts the number of pERM-positive filopodia presented in H and I (n = 53 per genotype). Data represent mean ± SEM. **p < 0.01, ***p < 0.001. K, Western blot analyses of pERM in lysates from nTg and G2019S cortical neurons after treatment with DMSO (−) or FSK (+). L, M, Representative images show G2019S neurons (at 2 DIV) stained with phalloidin (red) and βIII-tubulin (green) after treatment with DMSO (L) or FSK (M). Scale bar, 20 μm.

