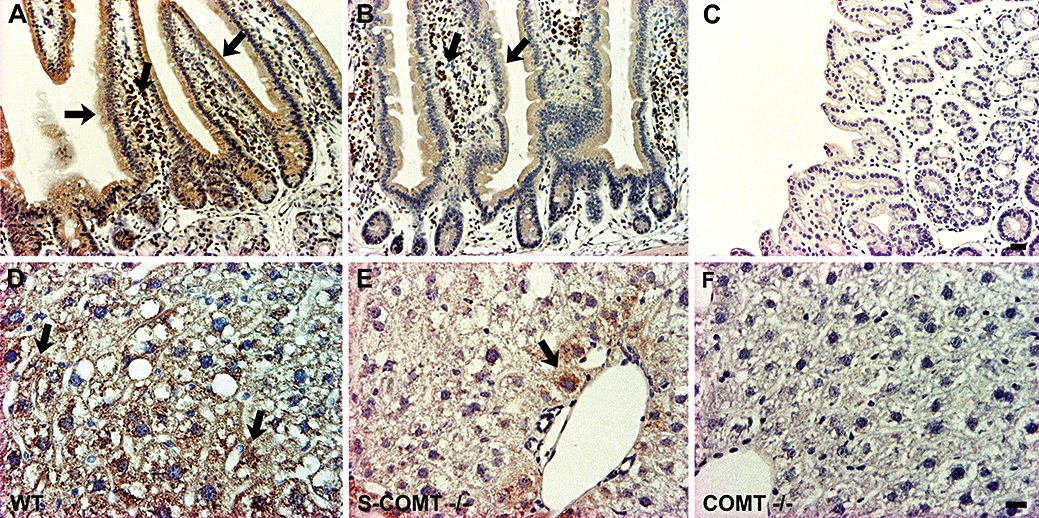
Figure 2.

Light-microscopic photomicrographs presenting the distribution of COMT in the duodenal (A–C) and liver (D–F) tissue of wild-type (WT), soluble catechol-O-methyltransferase (S-COMT)-deficient (S-COMT −/−) and catechol-O-methyltransferase (COMT) knock-out (COMT −/−) mice. COMT was visualized with DAB (brown colour) and nuclei were counterstained with Mayer's haematoxylin (blue colour). The lack of S-COMT clearly reduced the intensity of COMT-immunostaining. Moreover, in the S-COMT-deficient liver cells (E), COMT is seen more in the intracellular membranes than the plasma membrane. Scale bars are 20 µm (A–C) and 30 µm (D–F).
