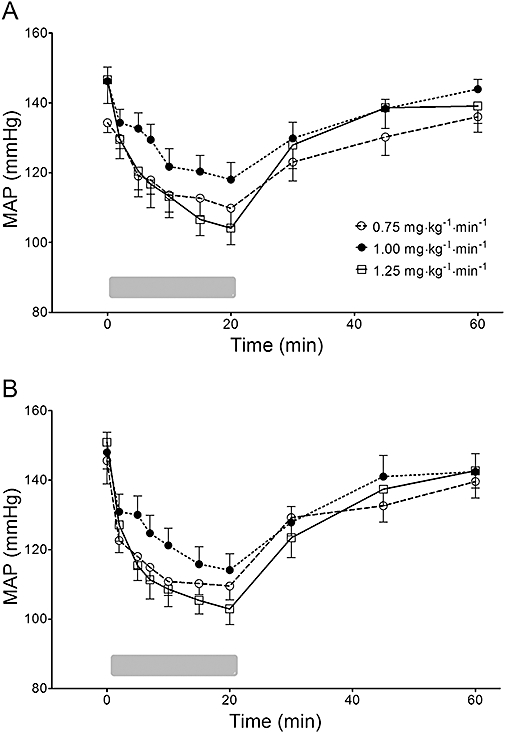
Figure 3.

Changes of mean arterial pressure (MAP) over time following zero-order infusion of microemulsion (A) and LCT propofol (B) for 20 min in beagle dogs. The gray bar at the bottom indicates infusion of propofol. Data are presented as mean ± SD (n= 10, each infusion rate). LCT, long-chain triglyceride emulsion.
