
Figure 6.
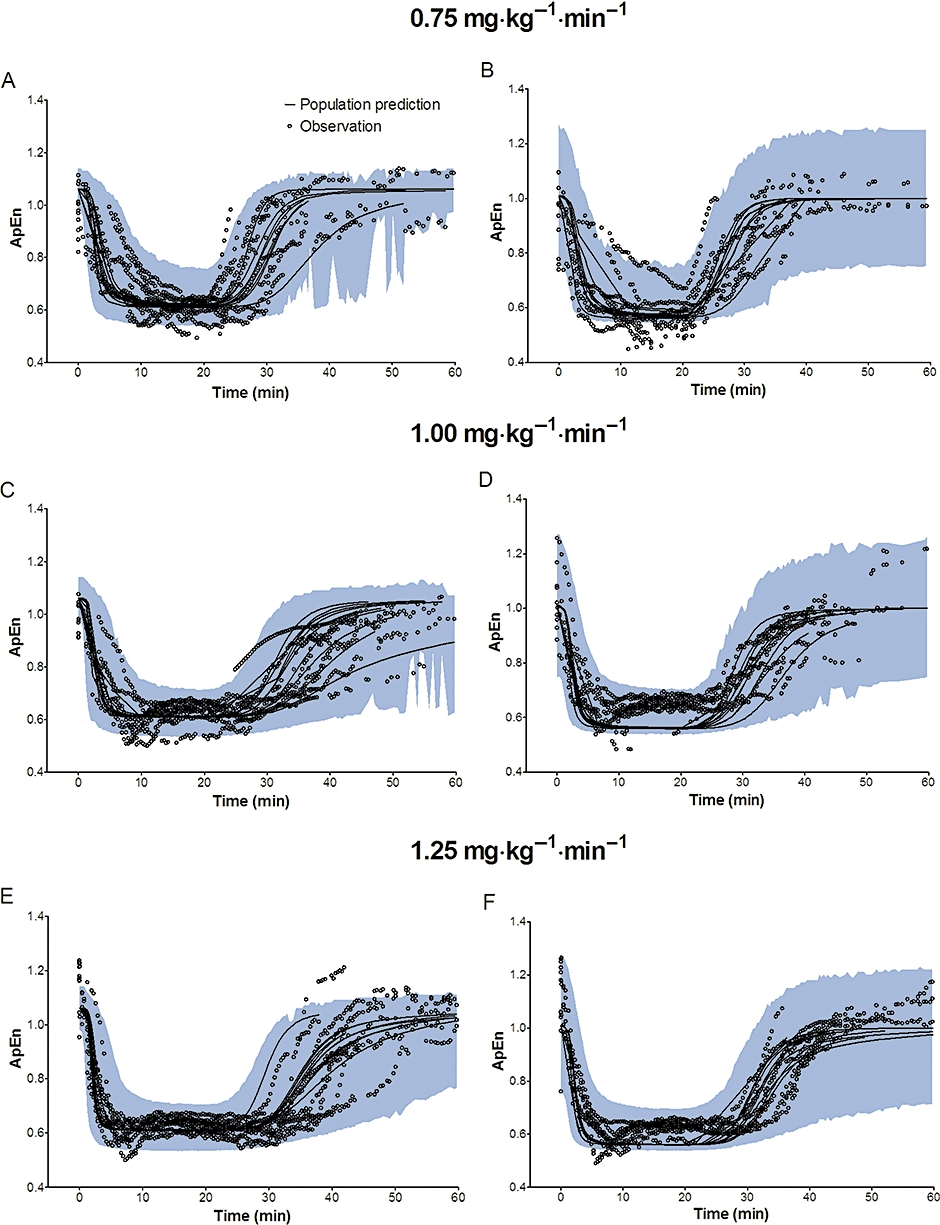
Predictive checks of electroencephalographic approximate entropy (ApEn) based on 2000 datasets at the infusion rate of 0.75 mg·kg−1·min−1, 1.00 mg·kg−1·min−1 and 1.25 mg·kg−1·min−1 in a crossover fashion. Most of the observed values lay within the 95% prediction interval and only a small portion of data distributed outside the 95% prediction intervals (A: 4.97%, C: 5.07%, E: 3.57% for microemulsion propofol, and B: 13.00%, D: 0.86%, F: 2.12% for LCT propofol), indicating that the final pharmacodynamics for both formulations are adequate to describe the time-courses of ApEn. The blue filled area represents the 95% prediction interval from the model. LCT, long-chain triglyceride emulsion.