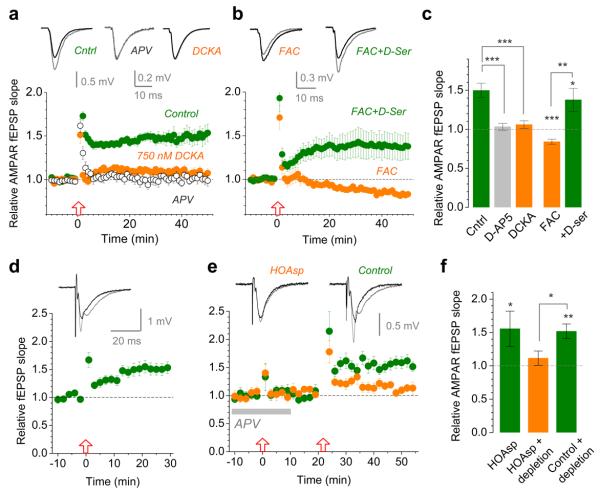
Figure 3. LTP expression depends on the occupancy of the NMDAR co-agonist sites controlled by D-serine synthesis in a nearby astrocyte.
a, LTP of AMPAR fEPSPs in control conditions (n = 10; green circles) is abolished by either 50 μM APV (open circles, n = 12) or 750 nM DCKA (n = 9; orange; dose-response curve in Supplementary Fig. 8). Traces, characteristic responses in control (black) and following LTP induction (grey).
b, Incubation with 5 mM FAC for >50 min blocks LTP (n = 16, orange circles) whereas 10 μM D-serine rescues it (n = 16; green circles). Notation is as in a.
c, Summary of experiments depicted in a-b. Bars, mean ± s.e.m. (applies throughout); *, p = 0.0127; **, p = 0.0014; ***, p < 0.001 (two-population t-test).
d, 400 μM intra-astrocyte HOAsp does not suppress LTP induction (potentiation is 50 ± 15%, n = 6, p = 0.021; arrangement as in Fig. 1a); traces, average fEPSPs before (black) and after (grey) application of HFS, one-cell example; time scale applies to d-e.
e, Intra-astrocyte HOAsp blocks induction of LTP (fEPSP change: +12 ± 11%, n = 7, p = 0.32; orange) following depletion of D-serine using HFS in APV; arrows, HFS onset. Omitting HOAsp robustly induces LTP (52 ± 11%, n = 6, p = 0.0052; green). HOAsp was unlikely to affect glutamate metabolism because no rundown of glutamatergic responses was observed.
f, Summary of experiments shown in d-e. * (left), p = 0.021; **, p = 0.0052 (one-population t-test); * (right), p = 0.024 (two-population t-test).

