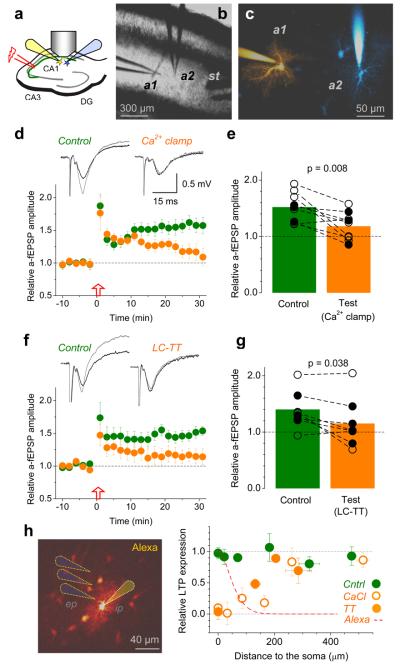
Figure 4. Individual astrocytes influence LTP induction mainly at nearby synapses.
a, Experimental arrangement; notations as in Fig. 1a.
b-c, An experiment seen in DIC (b) and in Alexa channel (c); a1 and a2, two patched astrocytes (λx2P = 800 nm, ~150 μm z-stack; false colours: sequential staining of a1 and a2 followed by subtraction of a1 image from combined a1+a2 image, Methods); st, stimulating electrode.
d, Ca2+ clamp in test astrocyte suppresses local LTP, but not LTP near the neighbouring control astrocyte. Graph, a-fEPSP amplitudes (mean ± s.e.m.) recorded from the control (green) and test (orange) astrocyte (n = 9). Traces, respective characteristic a-fEPSPs (Supplementary Fig. 11) recorded before (black) and after (grey) LTP induction. Incomplete blockade of early potentiation near the test cell was likely due to delayed equilibration between the two dialysing pipettes.
e, Summary of experiments in d; connected circles, recorded astrocyte pairs; black and hollow circles, experiments in which the test cell was, respectively, closer to and further away from the stimulating electrode (which might bias LTP expression); p-values, paired t-test (n = 9).
f-g, Experiments similar to those shown in d-e, but with the test astrocyte loaded with the LC-TT (n = 8). Other notation is as in d-e. Slow equilibration of high molecular weight LC-TT might explain incomplete block of early potentiation near the test cell.
h, Left panel, experimental arrangement (as in Fig. 1a-b): dotted cones, depiction of the extracellular pipette (ep). Graph: circles, relative potentiation (± s.e.m.) of AMPAR fEPSPs at different distances from the patched soma in control (n = 34; green), Ca2+-clamp (n = 48; open orange) and LC-TT (n = 15, filled orange) experiments. Dashed red line, the average emission intensity profile of Alexa (whole-cell loaded at 40 μM) escaping to neighbouring cells (n = 215 astrocytes imaged in eight 3-D stacks; details in Supplementary Fig. 13).

