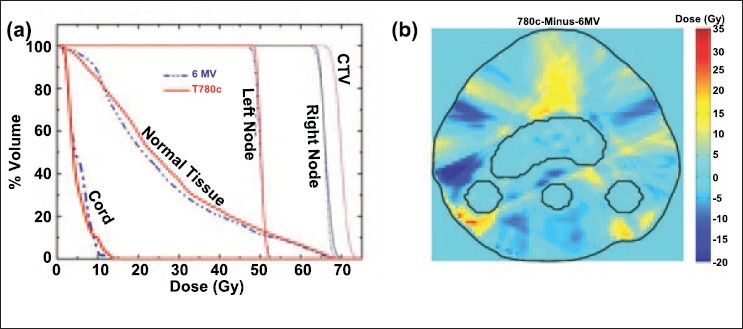
Figure 2.

(a) The dose area histogram (DAH) for the HandN tomotherapy plans from 6 MV linac and T780c Co-60 units with MIMiC MLCs. (b) The dose difference map: T780c plan minus 6 MV plan. The red and yellow regions illustrated higher doses (in Gy) with the T780c plan, the green and blue regions represent the higher doses with the 6 MV plan and the regions with background colour represent the region with negligible dose difference between the two plans
