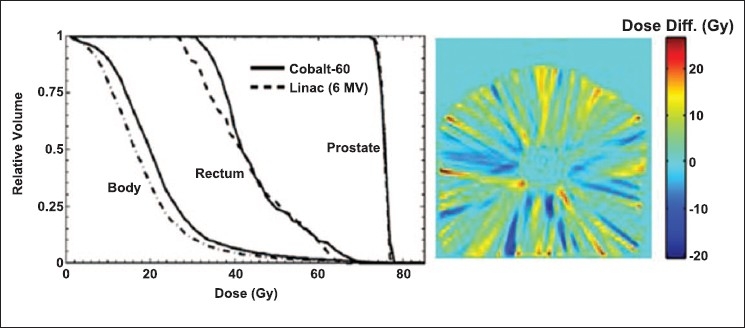
Figure 4.

Left: Cumulative dose area histograms for Co-60 and 6 MV linac based tomotherapy. Right: Dose difference map of Co-60 plan and 6 MV linac plan. In the dose difference map the yellow and red represent the regions where Co-60 is giving more dose than 6 MV and the blue regions represent the regions where 6 MV is giving more dose
