Figure 6c.

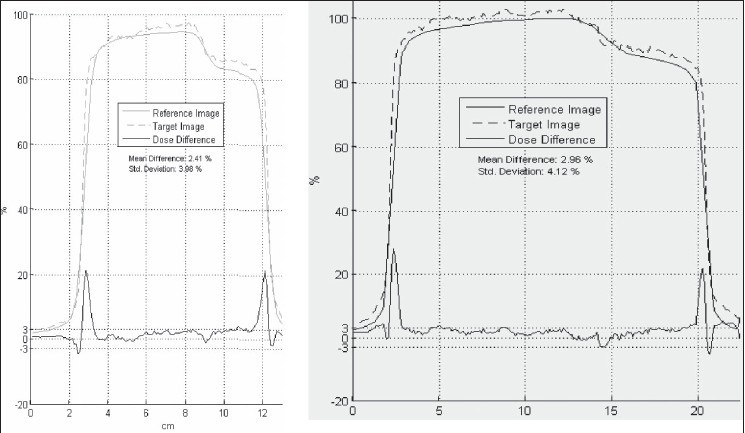
Calculated (plain) and measured (dashed) profiles along the two orthogonal lines. Mean difference is two to three per cent (Std deviation four per cent)

Calculated (plain) and measured (dashed) profiles along the two orthogonal lines. Mean difference is two to three per cent (Std deviation four per cent)