
Figure 4.
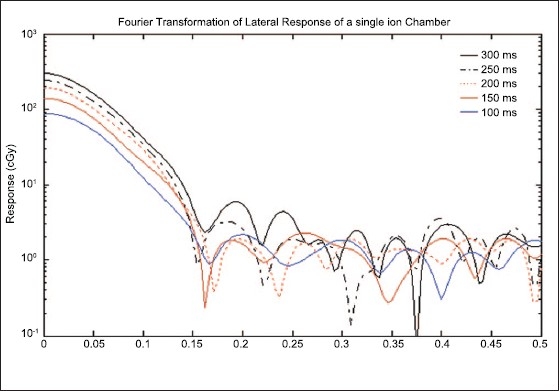
1D Fourier transformation of lateral response function for different sampling times of Figure 1. Continuous deep blue, brown and black color curves represent the 1D Fourier signal profiles of sampling time 100, 150 and 300 ms, respectively. Similarly discontinuous orange and black color curves represent those of 200 and 250 ms, respectively