
Figure 5.
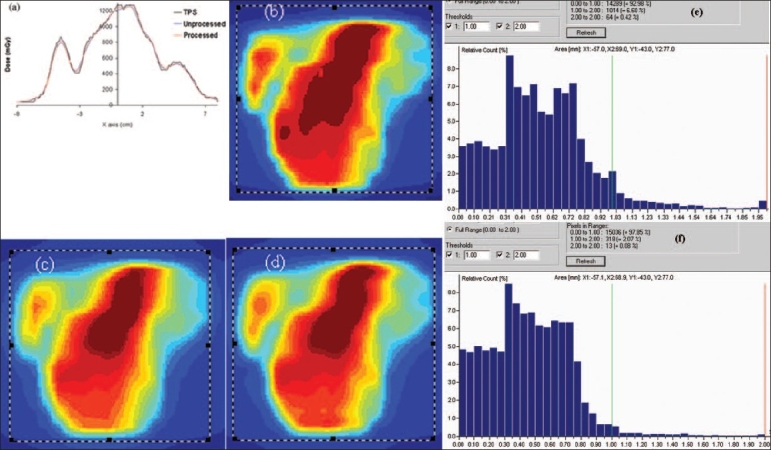
2D profile comparison of TPS, unprocessed profile of I'mRT MatriXX without any shift of position and processed profile of I'mRT MatriXX using multiple profiles acquisition at four different positions [(0,0); (3.81 mm, 0); (0, 3.81 mm) and (3.81 mm, 3.81 mm)]. a represents the 1D profile comparison of TPS 2D dose map (b), unprocessed (c) and processed (d) 2D dose maps of I'mRT MatriXX. Improvement of gamma histogram evaluation (delta distance = 3 mm and delta dose = 3%) by 5% from (e) TPS vs. unprocessed 2D profile to (f) TPS vs. processed 2D profile