
Figure 6.
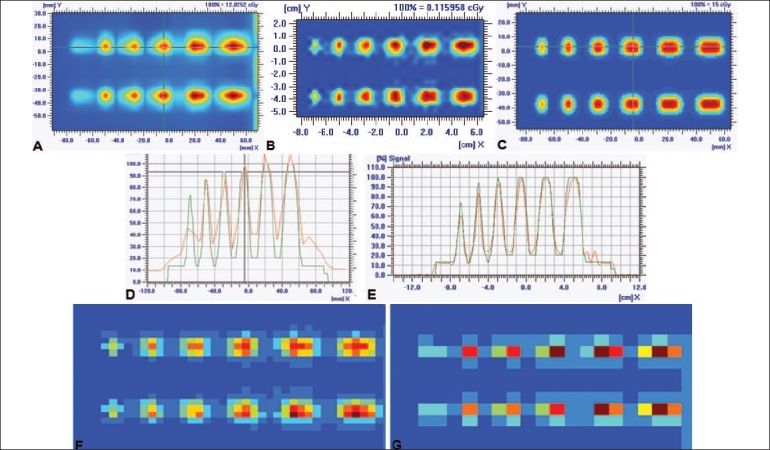
Comparison of 2D plane dose profiles of peak test between unprocessed profile of I'mRT MatriXX (A), processed profile of I'mRT MatriXX (B) and TPS (C). D represents the 1D profile comparison between TPS and unprocessed matrix data. E represents the 1D profile comparison between TPS and processed matrix data of I'mRT MatriXX with 4 adjacent shifts, showing the improvement of spatial resolution by detecting the 2.5 mm MLC gap, which cannot be resolved by unprocessed matrix data (D). Uninterpolated matrix data of processed profile (F) shows the increase of spatial resolution to up to 4 times as compared with that of unprocessed profile (G).