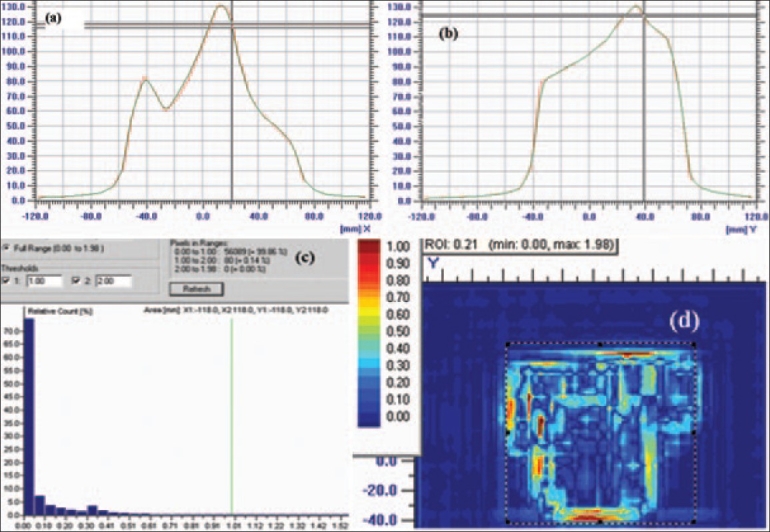
Figure 8.

2D dose profile comparison between convolved TPS profile and I'mRT MatriXX profile. (a) 1D profile comparison between I'mRT MatriXX and convolved TPS along x-axis and (b) 1D profile comparison between I'mRT MatriXX and convolved TPS along y-axis. Gamma histogram (c) of gamma values (d) depicted with color spectrum within the region of interest of 2D plane using delta dose 3% and delta distance 3 mm
