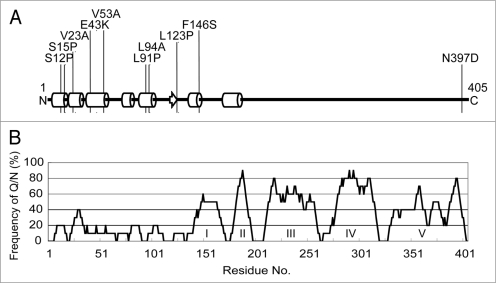
Figure 3.
Defective rnq1 mutations are localized to the N-terminal non-prion forming domain of Rnq1. (A) Secondary protein structure prediction of Rnq1 generated from the PSIPRED Protein Structure Prediction Server [http://bioinf.cs.ucl.ac.uk/psipred].35 Circular cylinders, an arrow and bold lines indicate α-helices, β-sheet and coils, respectively. Numbers represent the amino acid positions from the first Met codon. Positions of amino acid substitutions are shown. (B) Schematic diagram of non-Q/N rich and Q/N rich regions in the Rnq1 protein. The frequency of Q/N residues was calculated from every ten amino acid interval. Q/N-rich sub-regions are indicated in roman numerals.19 Note that amino acid positions are shown in the same scale in (A and B) for comparison.

