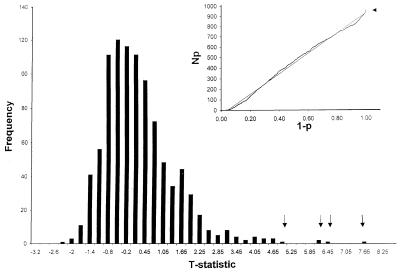
Figure 1.
Plot of test statistics obtained from the pair-wise linkage results. (Inset) A cumulative plot of P-values whose linearity would reflect uniformity in P-values associated with multiple linkage results whose null hypotheses were all true (see text). The outlying test statistics and P-values (denoted by arrows) were associated with markers, D4S107 (t = 6.24), D4S2949 (t = 7.79), D4S2928 (t = 5.03), D11S133 (t = 6.09), and D11S29 (t = 6.32).

