
Figure 4.
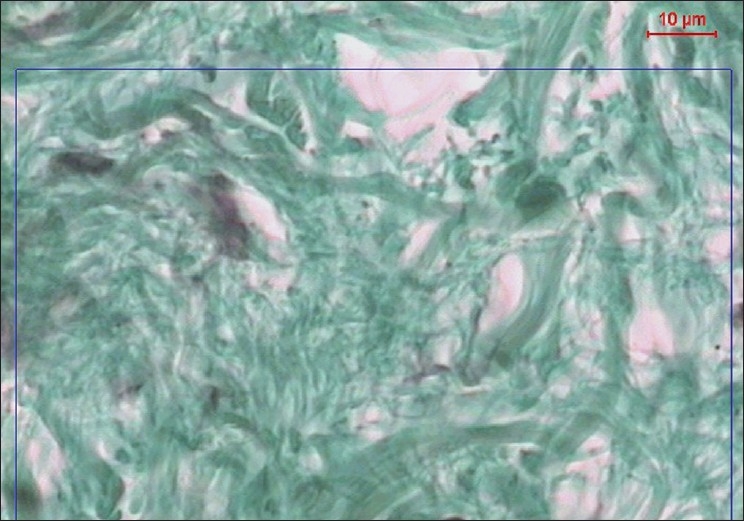
A copy of display on the monitor's screen of the image analyzer in diabetic participant showing collagen fibres in green color (Masson's trichrom, ×400)
Official websites use .gov
A
.gov website belongs to an official
government organization in the United States.
Secure .gov websites use HTTPS
A lock (
) or https:// means you've safely
connected to the .gov website. Share sensitive
information only on official, secure websites.
A copy of display on the monitor's screen of the image analyzer in diabetic participant showing collagen fibres in green color (Masson's trichrom, ×400)