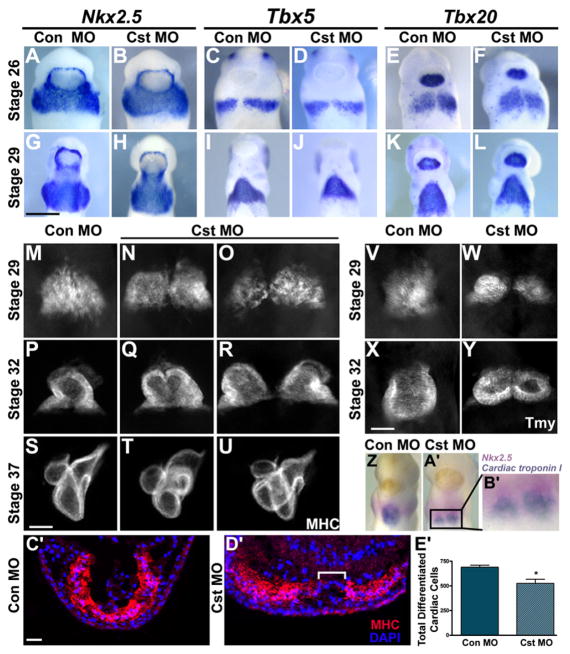
Figure 2. CST Is Required for Cardiomyocyte Differentiation at the Ventral Midline.
(A–L) Whole-mount in situ analysis with early cardiac markers Nkx2.5 (A, B, G, and H), Tbx5 (C, D, I, and J), and Tbx20 (E, F, K, and L) of tailbud Stage 26 and 29 control and CST-depleted embryos (ventral view with anterior to the top). Cardiac progenitors have properly migrated and completely fused across the ventral midline.
(M–U) Whole-mount MHC antibody staining at Stage 29 (onset of cardiac differentiation), Stage 32 (completion of linear heart tube formation), and Stage 37 (chamber formation) (ventral view with anterior to the top). (M) Stage 29 control MO embryos and (N and O) CST-depleted embryos. (P) Stage 32 control MO embryos and (Q and R) CST-depleted embryos display varying degrees of cardia bifida of the linear heart tube upon CST depletion. (S) Stage 37 control MO embryos and (T and U) CST-depleted embryos display morphological consequences of CST depletion on chamber formation.
(V–Y) Whole-mount Tmy antibody staining of Stage 29 and 32 (V and X) control MO and (W and Y) CST-depleted embryos demonstrates that lack of differentiation is not specific to MHC. (Z–B′) Simultaneous detection of cardiac progenitor cells and differentiated cardiac cells in a Stage 29 CST-depleted embryo.
(Z and A′) Whole-mount double in situ analysis using a Nkx2.5-specific probe (pink) to mark cardiac progenitor cells and Cardiac troponin I-specific probe (blue) to mark differentiated cardiac cells in (Z) control MO and (A′) CST-depleted embryos.
(B′) Magnified image of the cardiac region in the CST-depleted embryo in (A′).
(C′ and D′) Transverse sections of Stage 29 (C′) control MO and (D′) CST-depleted embryos stained with MHC antibody and DAPI. Brackets highlight the lack of differentiation at the ventral midline.
(E′) Quantification of differentiated cardiomyocytes determined by counting the total MHC-positive cells derived from serial sectioned embryos. Bars represent the average of at least six embryos per condition ± SEM; *p < 0.01. Representative images are derived from a single experiment, and all experiments were repeated at least twice with independent batches of embryos. Scale bars: (G) = 0.5 mm, (S and X) = 100 μm, (C′) = 200 μm.

