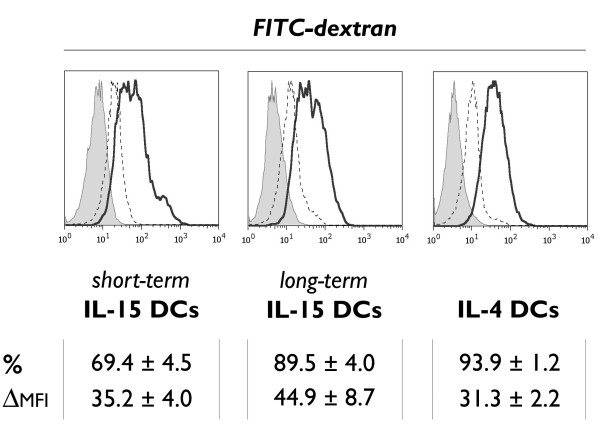
Figure 3.
Mannose receptor-mediated endocytosis of FITC-dextran particles. Histogram overlays depicting the in vitro uptake of FITC-dextran molecules by immature DCs, respectively short-term cultured IL-15 DCs (left), long-term cultured IL-15 DCs (middle) and control IL-4 DCs (right). The FITC-dextran endocytosis at 37°C (bold-line histograms) is compared to the non-specific fluorescence at 4°C (dashed-line histograms) and to the autofluorescence from unlabeled samples (grey-filled histograms), as described in "Methods". The uptake of FITC-dextran was quantified as mean ± SEM percentage of FITC-dextran positive cells (%) and as delta MFI ± SEM (ΔMFI), which was calculated by subtracting the MFI value of the non-specific FITC-dextran uptake at 4°C from the MFI value obtained at 37°C (n = 3).

