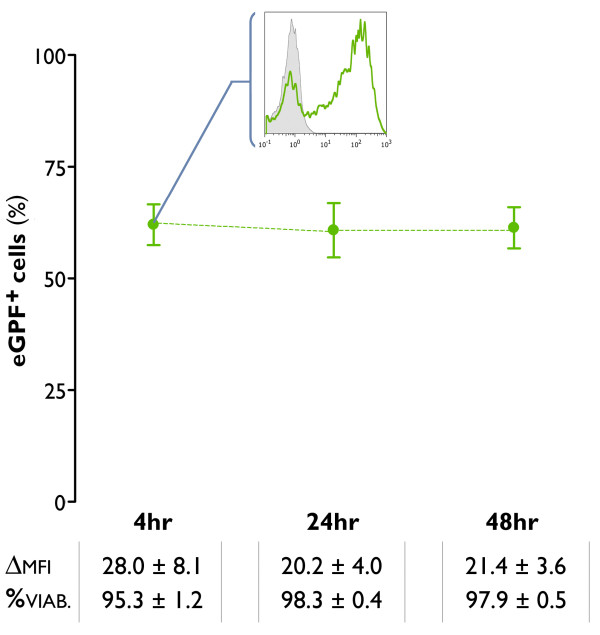
Figure 7.
mRNA transfectability of mature IL-15 DCs. Monocytes were cultured for 2 days with GM-CSF + IL-15, followed by a 24-hr incubation with a TLR7/8 agonist-based maturation cocktail (TLR-mDC). The resultant mDCs were harvested and electroporated with mRNA encoding the enhanced green fluorescent protein (eGFP). The green dots represent the mean ± SEM percentages of eGFP+ cells, as assessed by flow cytometry at different time points post-electroporation (4 hr, 24 hr, 48 hr). The insert shows a representative histogram overlay in which the flow cytometric eGFP expression 4 hr post-electroporation (green line histogram) is compared with the expression in a mock-electroporated negative control (grey-filled histogram). The values below indicate the delta MFI ± SEM of the eGFP expression (ΔMFI) and the mean ± SEM percentage of viable cells (%) at 4 hr, 24 hr and 48 hr following mRNA electrotransfection of IL-15 DCs (n = 5).

