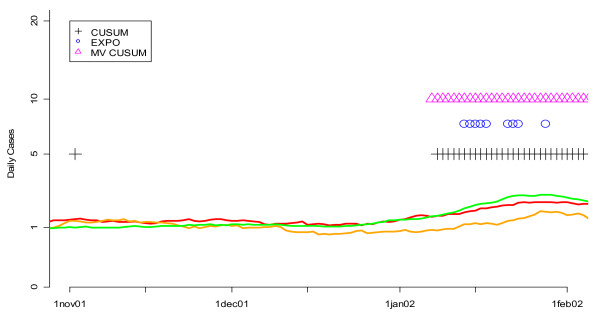
Figure 14.
Daily flags from the fine-tuned CUSUM, EXPO, and MV CUSUM algorithms when applied to three streams of unspecified infection data from hospitals S, M, and L during the winter of 2002. Orange, red and green lines show the smoothed values for unspecified infection daily counts from hospitals S, M, and L, respectively. Flagging times are also represented along the time axis with vertical lines that are color coded to the symbol. Note that the vertical axis is on a square root scale because of its variance stabilizing properties.

