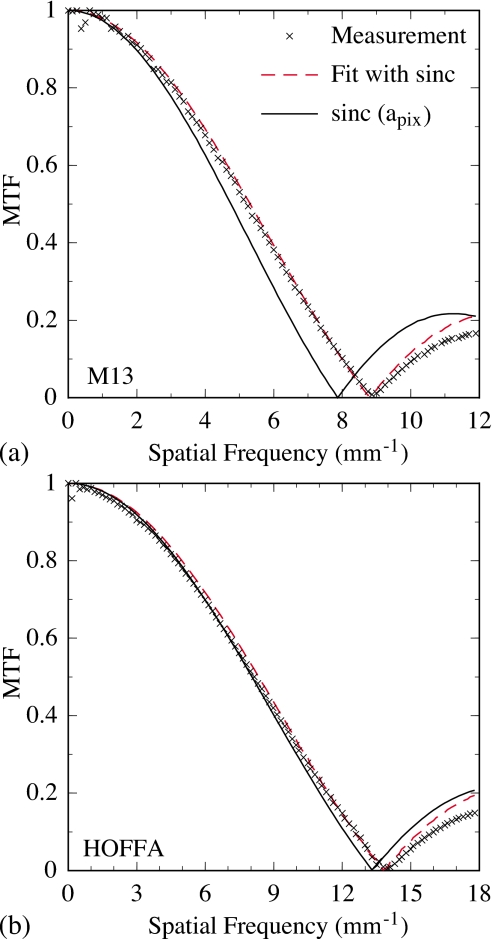
Figure 10.
Presampled modulation transfer functions associated with (a) M13 and (b) HOFFA. For each array, measurements of the optical MTF are indicated by the cross symbols, and data are shown up to spatial frequencies slightly beyond the first node. For each set of MTF measurements, the results of a fit of a sinc function to the data are indicated by the dashed lines, as described in the main text. Finally, for each array, a sinc function with an aperture value set to the pixel pitch of the array is plotted as a solid line for purposes of comparison.

