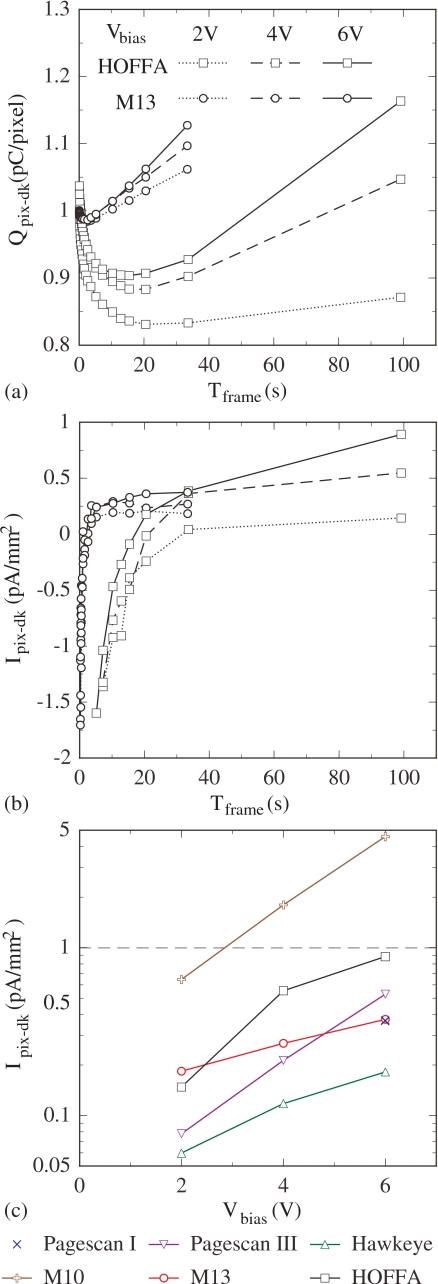
Figure 5.
Results for pixel dark signal and dark current at Vbias values of 2, 4, and 6 V. (a) Pixel dark signal, Qpix-dk, plotted as a function of Tframe for the M13 and HOFFA arrays. Note that pixel signal measurements from the arrays do not provide an absolute determination of dark signal due to the contribution of an unknown, constant offset from each preamplifier channel. Thus, to facilitate comparisons between the results of the two arrays, a fixed value has been added to the dark signal data set for each array so as to provide a common starting value (i.e., 1 pC∕pixel at a Tframe of 0.086 s for a Vbias of 2 V). The vertical scale in the plot continues to correctly quantify changes in dark signal as a function of Tframe and Vbias. (b) Pixel dark current, Ipix-dk, derived from the M13 and HOFFA data shown in (a), normalized to the geometric (i.e., full) area of the photodiodes, and plotted as a function of Tframe. (c) Pixel dark current results, determined under conditions where the photodiode contribution dominates, plotted as a function of Vbias for Pagescan III, Hawkeye, M10, M13, and HOFFA. A horizontal dashed line is drawn at a dark current level of 1 pA∕mm2 for purposes of comparison. Data from an earlier investigation of the Pagescan I array (Ref. 19) is also shown in (c) for purposes of comparison, as well as in Figs. 6e, 6f, 8e, 8f. In addition, note that the legend appearing in (a) also applies to (b), and the legend for (c) is shown below that graph. Finally, the lines connecting the data points in the graphs of this figure (as well as in graphs of Figs. 68) are drawn to guide the eye.

