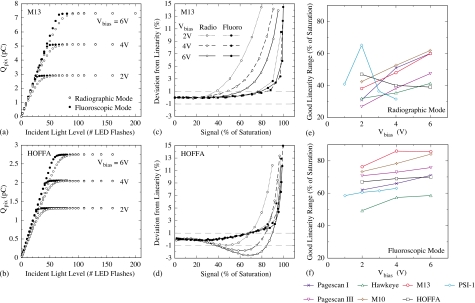
Figure 6.
Results for pixel response, as well as deviation from linearity of response, at Vbias values ranging from 1 to 6 V. Pixel signal, Qpix, is plotted as a function of incident light signal (in units of number of LED flashes) for (a) M13 and (b) HOFFA. In both figures, pixel signal response curves are shown for radiographic and fluoroscopic mode. For each response curve, the contribution of the dark signal has been subtracted. Deviation from linearity is plotted as a function of pixel signal size for (c) M13 and (d) HOFFA, corresponding to an analysis of the response curves in (a) and (b), respectively. The scale of the horizontal axis corresponds to the magnitude of the pixel signal, expressed as a percent of the dark-corrected saturation level – a convention also used in Fig. 8. Note that horizontal dashed lines are drawn at deviation levels of ±1%. The pixel signal size at which the magnitude of the nonlinearity first exceeds 1% is plotted as a function of Vbias for the sample arrays examined in this study for (e) radiographic mode and (f) fluoroscopic mode. Also note that the legends in (a) and (c) also apply to (b) and (d), respectively, and the legend for (e) and (f) is shown below these graphs.

